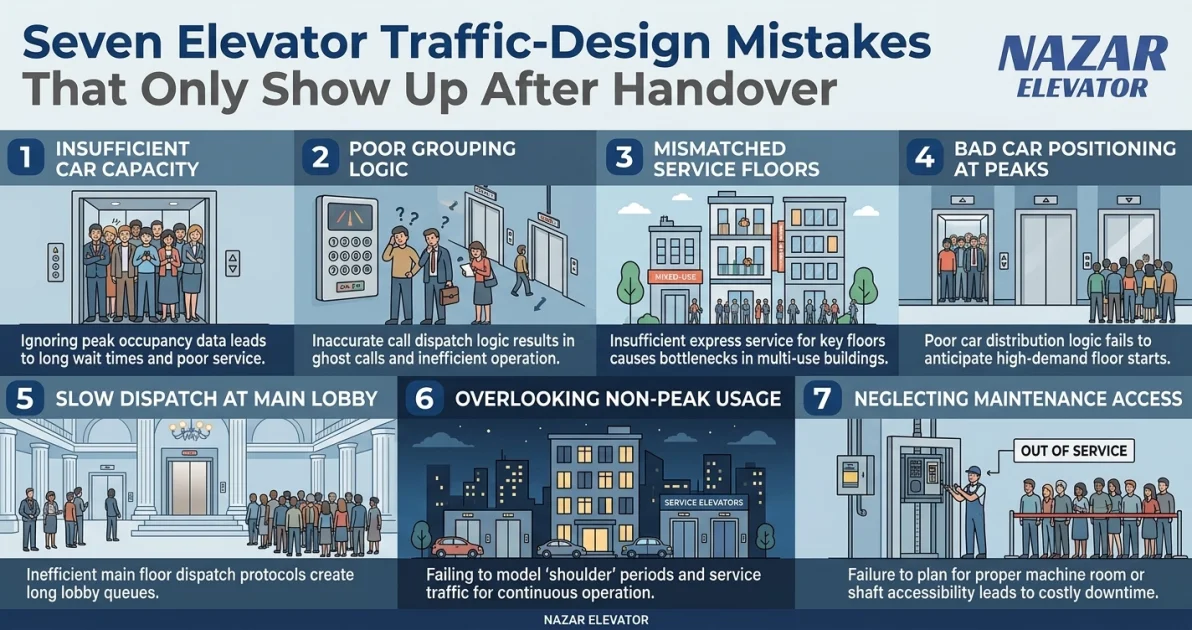
When occupants complain that the lifts are slow, the equipment is usually working exactly as specified. The problem is upstream: an assumption made during traffic design that was never wrong on paper, and never right in the building.
These seven errors share one property — the calculation passes and the installation still disappoints. Each is set out below with the arithmetic showing how much performance it costs, using the same ten-storey office example throughout: ten floors above the entrance, 3.5 m floor-to-floor, 500 m2 net per floor, three lifts of 1000 kg at 1.6 m/s. In its correct form that building has a round trip time of 133.2 s, an interval of 44.4 s and a handling capacity of 67.6 persons per five minutes.
1. Estimating population from desks instead of area and density
What happens after handover: the building fills to its real density and the lifts that were adequate for the initial fit-out no longer are. This is the most expensive error on the list because it cannot be fixed without adding a car.
The arithmetic: at 10 m2 per person the example building holds 500 people and demands 60 arrivals in five minutes — the three lifts deliver 67.6, so it passes. Re-let the same floors as open plan at 8 m2 per person and the population becomes 625, demand becomes 75, and the same installation now meets only 90% of it. Nothing about the equipment changed.
The fix: derive population from net internal area divided by an occupant density agreed with the client in writing, and design to the density the building could reach, not the one the first tenant happens to want.
2. Calculating with rated car capacity instead of the 80% load factor
What happens after handover: the installation moves fewer people than the design report promised, and nobody can point to a component that is underperforming.
The arithmetic: a 1000 kg car is rated for 13 persons, but passengers stop boarding at about 80% of rated capacity, so it carries around 10. Calculating with 13 predicts a handling capacity of 78.2 persons per five minutes; the installation actually delivers 67.6. That is an overstatement of about 16%. The error is not simply 30% — the larger passenger count also produces more stops, lengthening round trip time from 133.2 s to 149.7 s — but the direction is consistently optimistic.
The fix: calculate on 80% of rated persons. Always.
3. Taking door and levelling times from the best case
What happens after handover: the interval measured on site is longer than the interval in the report, and the difference cannot be traced to any single fault.
The arithmetic: in the example, stopping consumes 67.6 s of the 133.2 s round trip — more than half the cycle. Design on a stop cost of 7.0 s and get 11.0 s in the installed configuration, and the interval moves from 39.4 s to 49.4 s. That is 25% of the service quality, lost to four seconds of door and levelling time.
The fix: use door times for the doors actually specified, at the actual opening width, with the actual door operator — not the catalogue minimum. Verify on site during commissioning.
4. Checking handling capacity and never checking interval
What happens after handover: the design report says the installation is compliant, and the lobby says otherwise. This is the most common single cause of disputes after occupation.
The arithmetic: the example building delivers 13.5% handling capacity against a 12% design demand, so on throughput it passes comfortably. Its interval is 44.4 s, implying an average lobby wait near 18 s and a worst case around twice that. Common office guidance treats intervals beyond 40 s as the point where occupants begin to complain. Capacity and interval can disagree, and the occupant experiences the interval.
The fix: report both figures, and set a target interval in the brief alongside the capacity target.
5. Applying pure up-peak analysis to a building with more than one entrance
What happens after handover: the morning peak is fine and the building still feels congested at other times, particularly around lunch and at shift changes.
The problem: the up-peak formulas assume every passenger boards at a single main terminal and travels upward. A basement car park, a canteen floor, a gym or a second street entrance creates a second origin and substantial interfloor traffic. The analytical model does not represent those flows at all — it is not that it represents them inaccurately.
The fix: where a second entrance or a strong internal destination exists, up-peak calculation is a screening tool only. ISO 8100-32:2020 provides a simulation method precisely for these patterns, and it should be used.
6. Letting one group serve too many floors
What happens after handover: the upper floors get a visibly worse service than the lower ones, and the building acquires a reputation among its own tenants.
The arithmetic: extend the example from ten served floors to sixteen with the same three lifts. Round trip time rises from 133.2 s to 167.1 s and the interval from 44.4 s to 55.7 s — a 25% degradation. Meanwhile the population has grown to 800, so handling capacity falls from 13.5% to 6.7% of population. The installation now fails on both measures at once.
The fix: above roughly twelve to fifteen served floors, test zoning against a single group. Splitting the same sixteen floors into two zones changes the whole shape of the answer, and the comparison takes minutes to run.
7. Assuming every car is always available
What happens after handover: the building performs acceptably until the first planned maintenance visit, a goods delivery, or a firefighting-lift test — and then it does not.
The arithmetic: take one car of the three out of service. The interval rises from 44.4 s to 66.6 s, a 50% degradation, and handling capacity falls from 67.6 to 45.0 persons per five minutes — that is 9.0% of population against a 12% design demand. With one car down, the installation no longer meets its own design brief.
The fix: run the calculation with one car withdrawn and agree with the client what level of service is acceptable in that condition. If the answer is unacceptable and the group has only three cars, that is an argument for a fourth — made before the shafts are poured, not after.
How to catch these before sign-off
- Ask which occupant density the population figure came from, and whether the client has agreed it in writing.
- Confirm the passenger count used in the calculation is 80% of rated, not rated.
- Check that door and levelling times match the specified door operator and opening width.
- Require both handling capacity and interval in the design report, against stated targets.
- Ask whether the building has a second entrance, a canteen level or a car park — and if so, whether simulation was used.
- Above twelve served floors, ask to see the zoning comparison.
- Ask for the interval with one car out of service.
None of these questions requires access to the calculation software. All seven can be asked in a design review meeting, and the answers reveal whether the traffic study was done properly.
Frequently asked questions
Why do lift traffic problems appear only after the building is occupied?
Because the calculation is performed against assumed inputs — population, arrival rate, door times, car loading — and occupation is the first time those assumptions meet reality. The equipment is rarely at fault; the assumptions are.
Can a lift installation that passes its calculation still be too slow?
Yes, and it is common. Handling capacity and interval are different measures and can diverge. An installation delivering 13.5% capacity against a 12% requirement passes on throughput while presenting a 44.4-second interval, which occupants experience as a slow building.
How much performance is lost when one car is out of service?
In a three-car group, roughly half. Interval rises by 50% — from 44.4 to 66.6 seconds in the worked example — and handling capacity falls by a third, from 13.5% to 9.0% of population. Any group of three or fewer cars should be checked in this condition during design.
Is it worth adding a fourth lift instead of a faster one?
Usually, below about fifteen floors. Adding a car divides the interval directly, whereas raising rated speed only shortens the travel component of round trip time — which in the example is 31% of the cycle, against 51% consumed by stopping.
When should traffic simulation be used instead of hand calculation?
When the governing pattern is not up-peak: buildings with more than one entrance, a canteen or gym floor, hotel check-out peaks, mixed-use towers, and any installation with destination control. ISO 8100-32:2020 defines a simulation method for exactly these cases.
Who is responsible when the lifts underperform but comply with the calculation?
In practice the dispute turns on which inputs were agreed and by whom. That is why occupant density, design arrival rate and target interval should be recorded in writing at briefing stage — they cannot be renegotiated after handover by adjusting the installation.
Summary
Seven assumptions cause most post-handover lift complaints: population taken from desks rather than density, rated capacity used instead of 80% loading, optimistic door times, interval never checked, up-peak analysis applied to a multi-entrance building, one group stretched over too many floors, and no allowance for a car out of service. Each is visible in the arithmetic before construction. None is fixable cheaply afterwards.