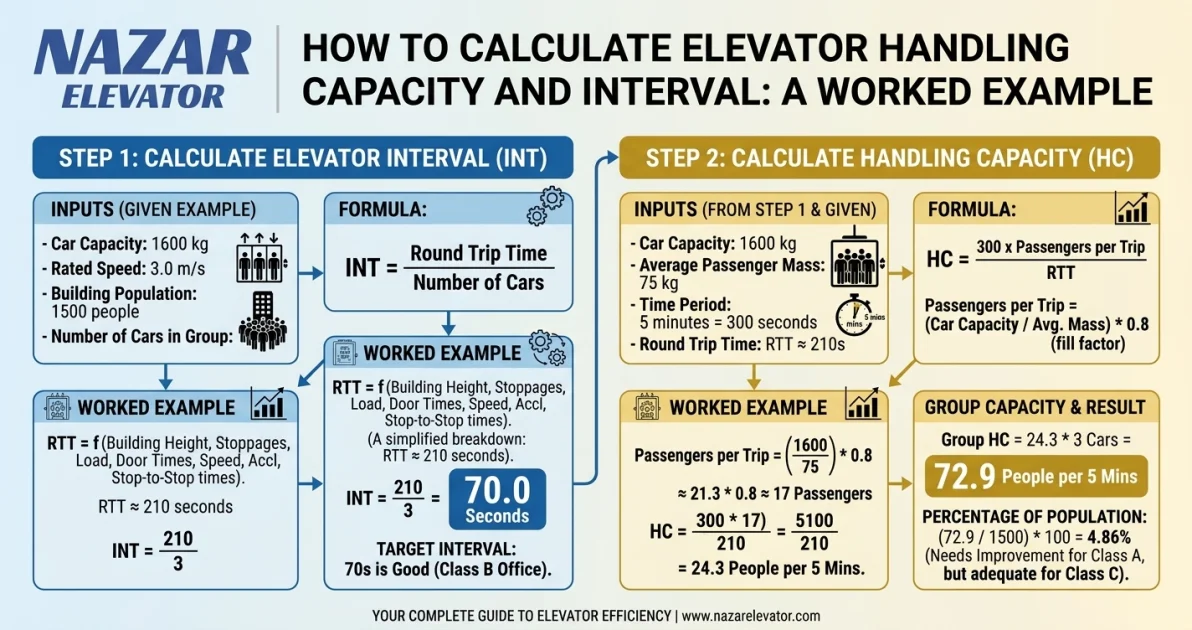
Every passenger lift group is judged on two numbers. Handling capacity is how many people the group can move in five minutes. Interval is how long passes between one car leaving the main terminal and the next one leaving. A building can satisfy the first and still feel slow because it fails the second — which is why both must be calculated, not one.
This article derives both figures from first principles and then works through a complete example for a ten-storey office building. Every input is stated, so the calculation can be reproduced or adapted.
What the two numbers measure
Handling capacity (HC) is expressed as persons per five minutes, or as a percentage of the building population served in five minutes (%POP). It answers a throughput question: can the installation clear the morning arrival rush at all?
Interval (INT), sometimes called average waiting interval, is the average time between successive car departures from the main entrance floor. It answers a service-quality question: how long does an individual passenger stand in the lobby? Average waiting time is roughly 0.4 x interval under up-peak conditions with conventional group control.
The two are related through round trip time (RTT) — the average time for one car to leave the entrance floor, serve its passengers, and return ready to load again. RTT is the engine of the whole calculation.
The five inputs you need before calculating
- Building population — derived from net internal area and occupant density, not from the number of desks someone remembers.
- Design arrival rate — the percentage of that population arriving in the busiest five minutes.
- Number of floors served above the main entrance, and the floor-to-floor distance.
- Car capacity and load factor — passengers actually carried, which is well below the rated figure.
- Time constants — rated speed, the time a stop costs, and passenger transfer time.
Step 1 — Building population
Population is net internal area divided by occupant density. For general office space, 10 m2 per person is a common planning density; densely occupied floors may use 8 m2 and prestige space 12 to 15 m2. The density assumption drives everything downstream, so it should be agreed with the client in writing rather than assumed.
Step 2 — Design arrival rate
Up-peak demand is expressed as the percentage of the population arriving in the busiest five minutes. For a single-tenant office with a fixed start time, 15% is a demanding but realistic figure. For multi-tenant offices with staggered hours, 11 to 13% is more typical. Residential buildings are far lower; hotels behave differently again and are usually dominated by two-way traffic rather than pure up-peak.
Step 3 — Passengers per trip
A car rated for 13 persons does not carry 13 people. Passengers stop boarding when the car feels full, typically at about 80% of rated capacity. This car load factor is the single most common source of over-optimistic traffic calculations. Use:
P = rated persons x 0.80
Step 4 — Expected stops and highest reversal floor
A car carrying P passengers to N possible floors will not stop N times. The expected number of stops is:
S = N x [1 - (1 - 1/N)^P]
The highest floor the car reaches before reversing is:
H = N - sum from i=1 to N-1 of (i/N)^P
Both formulas assume passengers are equally likely to travel to any served floor. Where floor populations differ materially — a canteen level, a large single tenant — the assumption breaks and simulation should replace hand calculation.
Step 5 — Round trip time
The classic up-peak round trip time is:
RTT = 2 x H x tv + (S + 1) x ts + 2 x P x tp
where tv is the time to travel one floor at rated speed, ts is the time a stop costs (door opening, door closing, and the acceleration and levelling losses that a non-stop pass would not incur), and tp is the time for one passenger to enter or leave the car.
Step 6 — Interval and handling capacity
For a group of L cars:
Interval = RTT / L
Handling capacity = 300 x P x L / RTT persons per five minutes
%POP = handling capacity / building population x 100
Worked example: a ten-storey office building
Assumptions: ten floors served above the main entrance; 3.5 m floor-to-floor; 500 m2 net area per floor at 10 m2 per person; 12% arrival rate; three lifts rated 1000 kg (13 persons) at 1.6 m/s; a stop costs 9.0 s; passenger transfer 1.2 s.
| Quantity | Working | Result |
|---|---|---|
| Building population | 10 floors x 500 m2 / 10 m2 | 500 persons |
| Five-minute demand | 500 x 12% | 60 persons |
| Passengers per trip | 13 x 0.80 | 10 persons |
| Single-floor transit time | 3.5 / 1.6 | 2.19 s |
| Expected stops | 10 x [1 - 0.9^10] | 6.51 |
| Highest reversal floor | 10 - 0.491 | 9.51 |
| Travel component | 2 x 9.51 x 2.19 | 41.6 s |
| Stopping component | (6.51 + 1) x 9.0 | 67.6 s |
| Transfer component | 2 x 10 x 1.2 | 24.0 s |
| Round trip time | sum of the three | 133.2 s |
| Interval (3 lifts) | 133.2 / 3 | 44.4 s |
| Handling capacity | 300 x 10 x 3 / 133.2 | 67.6 persons / 5 min |
| %POP | 67.6 / 500 | 13.5% |
Reading the result: capacity passes, interval does not
The installation delivers 13.5% against a 12% demand, so on throughput it passes. But the interval is 44.4 seconds, implying an average lobby wait of about 18 seconds and a worst case roughly twice that. Widely used office guidance treats intervals up to about 30 seconds as excellent and 30 to 40 seconds as good; beyond 40 seconds occupants begin to complain regardless of what the capacity figure says.
This is the single most important lesson in lift traffic design: capacity and interval can disagree, and the occupant experiences the interval. Adding a fourth car to the same shafts changes the picture — interval falls to 33.3 seconds and capacity rises to 18% — because interval divides by the number of cars while round trip time stays the same.
What actually moves the number
In the worked example, the three components of round trip time divide as follows: travel 41.6 s (31%), stopping 67.6 s (51%), passenger transfer 24.0 s (18%). Stopping consumes more than half the cycle. That reframes where design effort belongs.
| Change | Round trip time | Interval (3 lifts) |
|---|---|---|
| Rated speed 1.0 m/s | 158.2 s | 52.7 s |
| Rated speed 1.6 m/s (base case) | 133.2 s | 44.4 s |
| Rated speed 2.5 m/s | 118.2 s | 39.4 s |
| Stop cost 11.0 s | 148.2 s | 49.4 s |
| Stop cost 9.0 s (base case) | 133.2 s | 44.4 s |
| Stop cost 7.0 s | 118.2 s | 39.4 s |
Raising rated speed from 1.0 to 2.5 m/s — a 150% increase, with the cost and machine-room implications that carries — removes 40 seconds from the round trip. Reducing the cost of a stop from 11.0 to 7.0 seconds removes 30 seconds. Four seconds of door and levelling time is worth almost as much as more than doubling the rated speed, and it is usually far cheaper to buy. In a ten-storey building, door performance and drive control quality deserve more attention than the headline speed figure.
Where ISO 8100-32 fits
ISO 8100-32:2020, Lifts for the transportation of persons and goods — Part 32: Planning and selection of passenger lifts to be installed in office, hotel and residential buildings, is the current international standard for this work; it was reviewed and confirmed in 2025. It replaced a 1984 predecessor that addressed residential buildings only, and it now covers offices, hotels and residential buildings together.
Two points matter for practitioners. First, the standard sets out an up-peak calculation of the kind derived above, so hand calculation remains a legitimate design tool. Second, it also defines a simulation method for traffic patterns that up-peak analysis does not represent — lunchtime two-way flow, hotel check-out peaks, mixed-use towers, and any building with destination control. If the building has a strong non-up-peak pattern, the arithmetic above is a screening tool, not an answer.
Common mistakes
- Using rated capacity instead of 80% loading. In the worked example above this overstates handling capacity by about 16% — 78.2 instead of 67.6 persons per five minutes.
- Ignoring the cost of a stop. Door times and levelling losses dominate the cycle in low- and mid-rise buildings.
- Calculating capacity and declaring victory. Interval is what occupants feel.
- Assuming uniform floor populations when one floor holds a canteen, an auditorium or a single large tenant.
- Applying office arrival rates to residential or hotel buildings, whose traffic patterns are structurally different.
- Sizing on up-peak alone in buildings whose real constraint is lunchtime or two-way traffic.
Frequently asked questions
What is a good handling capacity for an office building?
The installation should at minimum meet the design arrival rate. For a single-tenant office with synchronised start times, that demand is commonly taken as 15% of population in five minutes; for multi-tenant buildings, 11 to 13% is more usual. The figure is a design input agreed with the client, not a universal constant.
What is the difference between interval and waiting time?
Interval is the average time between successive car departures from the entrance floor. Waiting time is what an individual passenger experiences, and under up-peak conditions with conventional control it averages roughly 0.4 times the interval. A 45-second interval therefore implies about 18 seconds of average wait, with a worst case around twice that.
Does a faster lift always improve traffic performance?
No. In the ten-storey example, raising rated speed from 1.0 to 2.5 m/s reduces round trip time by 40 seconds, while cutting four seconds from the cost of each stop reduces it by 30 seconds. Below roughly fifteen floors, door and levelling performance usually matters more than rated speed, because the car spends more of its cycle stopping than travelling.
How many passengers does a 1000 kg lift actually carry?
A 1000 kg car is rated for 13 persons but should be calculated at about 10, because passengers stop boarding at roughly 80% of rated capacity. Designing on the rated figure is one of the most common causes of an installation that calculates well and performs badly.
When is hand calculation not enough?
When the governing traffic pattern is not up-peak. Lunchtime two-way flow, hotel check-out peaks, mixed-use towers and any installation with destination control require the simulation method described in ISO 8100-32:2020, because the analytical up-peak formulas do not represent those flows.
Which inputs should be agreed with the client before calculating?
Occupant density, design arrival rate, and the target interval. These three drive the result more than any equipment choice, and disagreement about them after handover cannot be resolved by adjusting the installation.
Summary
Handling capacity and interval both derive from round trip time. Calculate population from area and density, take 80% of rated car capacity, compute expected stops and highest reversal floor, assemble round trip time from its travel, stopping and transfer components, then divide by the number of cars for interval and scale to five minutes for capacity. Check both. In the ten-storey office above, the group meets its capacity target and still delivers a marginal interval — and it is the interval that occupants will talk about.